Construction

For GCs and progress documentation

Weekly site flights, progress maps, volume measurements and one portal link for the owner, the architect and the PM.

Production construction-site mapping footage from a working drone operator.

How it flows

From weekly flight to stakeholder dashboard.

1 · WEEKLY FLIGHT Repeatable flight plan Same path, same time 2 · ORTHO Cloud processing Ortho · DSM · volumes 3 · MEASURE Stockpile and earthwork volumes Polygon to volume 4 · STAKEHOLDER PORTAL Owners + architects + PM see the same view Branded · per-permission

The whole site

One map of the site, every flight

Upload the photos and SkyPLX-9, our mapping engine, stitches the whole site into one orthomosaic you can zoom into. This is a construction site in Costa Mesa, California, from our own account, 1,077 photos in one map.

  • Orthomosaic of the whole site
  • Point cloud, elevation model and 3D model from the same photos
  • Processing cost shown in credits before you start
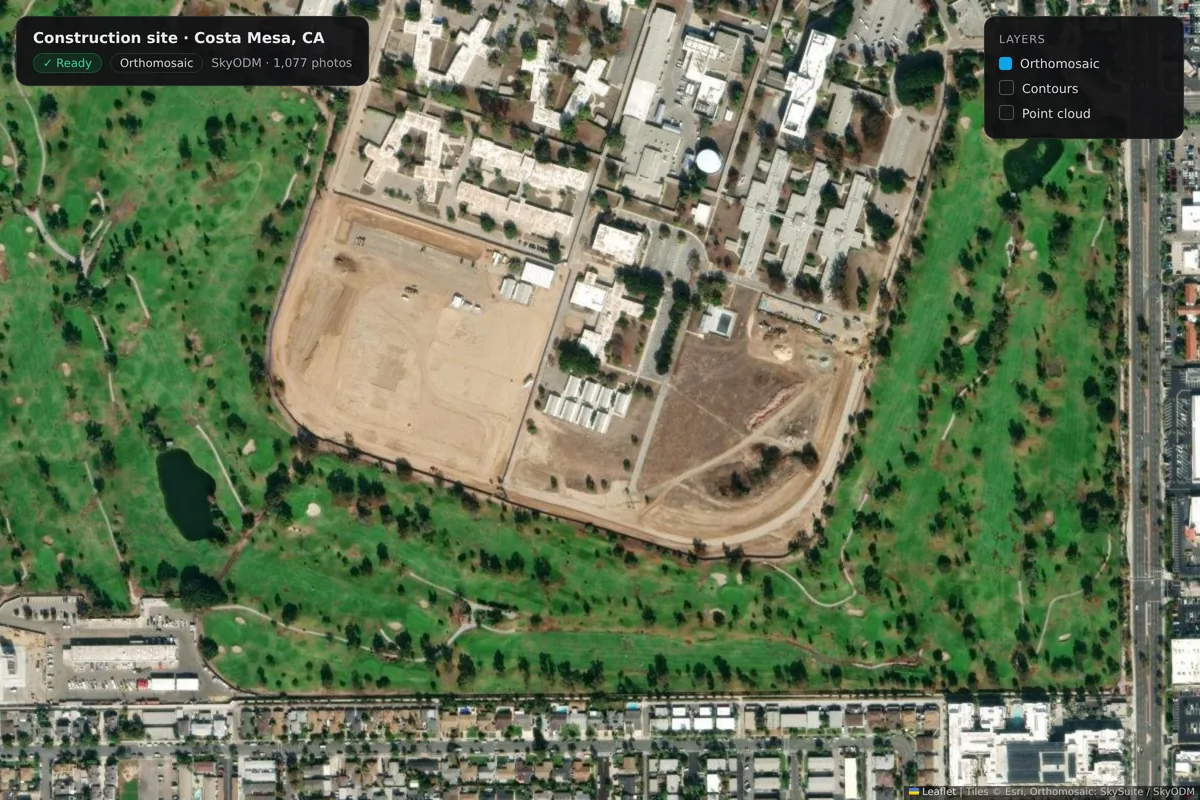
The Costa Mesa construction-site orthomosaic over satellite imagery: the graded pad, site roads, modular buildings and the surrounding fairways, with the map's layers panel.

Progress

See the equipment and the earth move

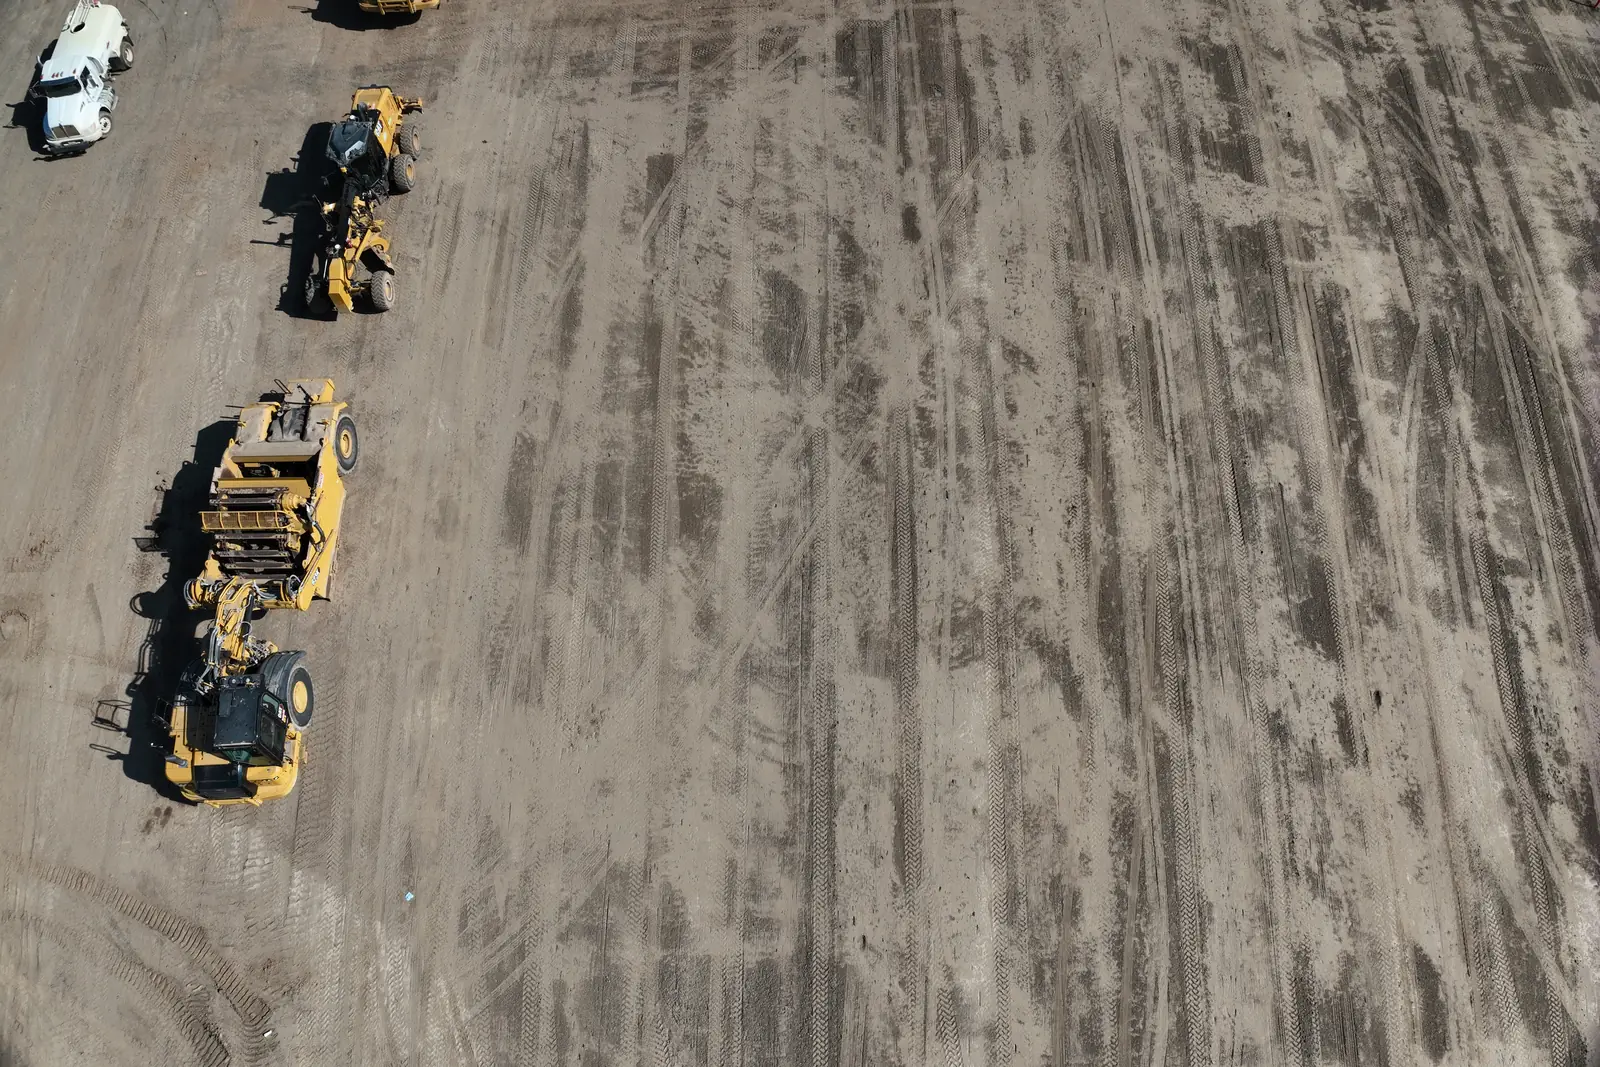
Fly the same site every week and keep each photo set with the project, so you can show the owner what changed and when.

  • Every visit's photos on the project
  • The same site, week after week
Graders and a loader lined up on a freshly graded construction pad, seen from above.

Grades and contours

Contours over the ground you just flew

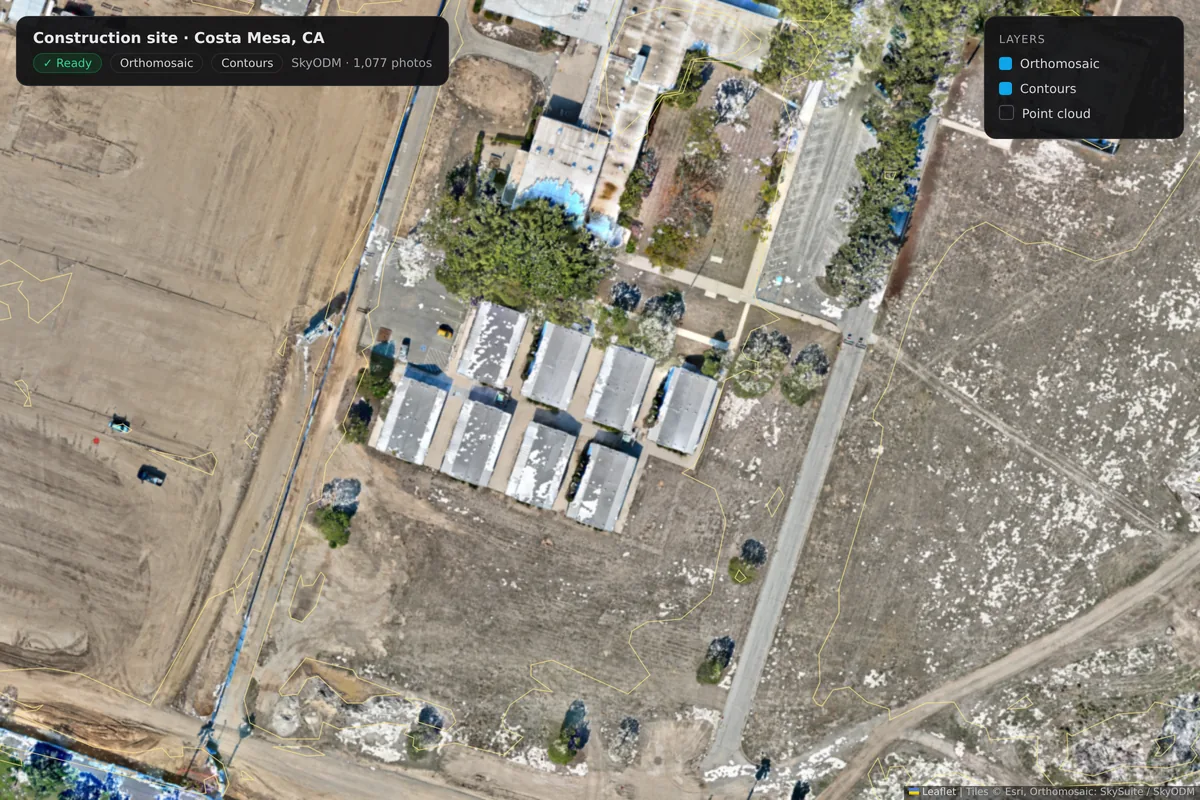
Turn on contours over the orthomosaic to see how the pad is graded. Zoom in close; the map keeps the detail of the original photos.

  • Contour lines over the orthomosaic
  • Close-up detail from the source photos
A close-up of the Costa Mesa construction site with contour lines turned on over the orthomosaic: modular buildings, a site road and graded ground.

Stockpiles

Piles you can measure

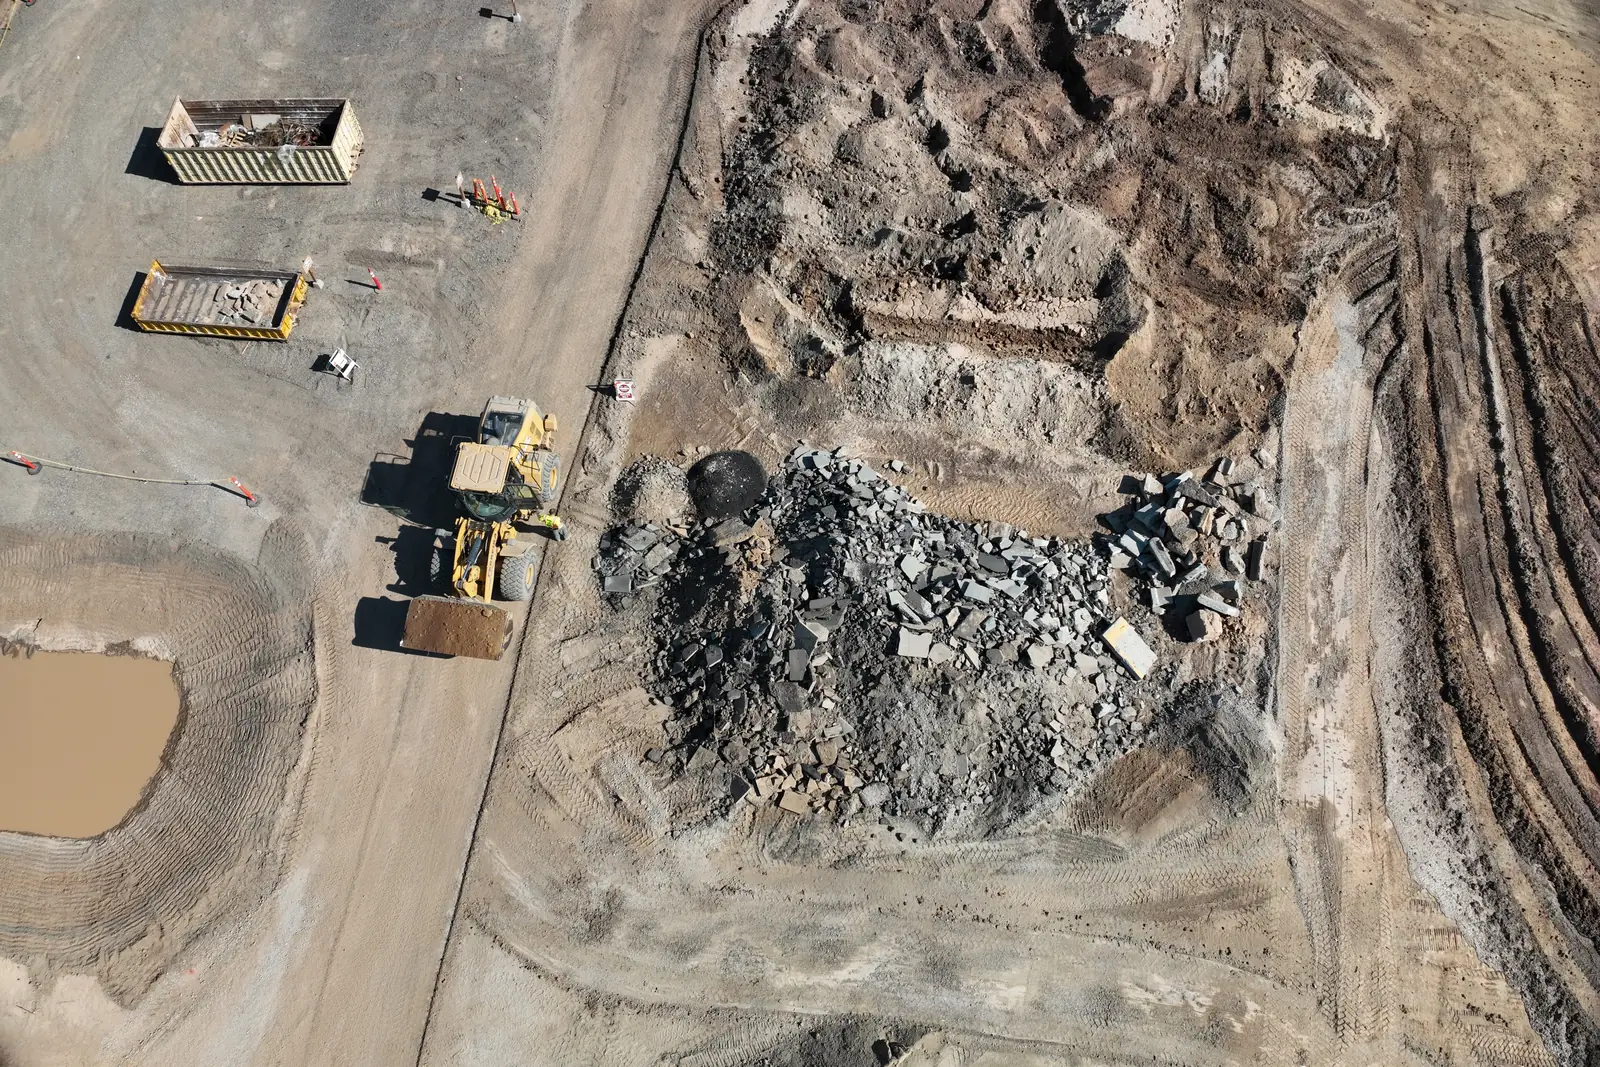
Rubble, soil and aggregate piles stand out clearly from the air. Once the map is built, draw around one and read its volume.

  • Stockpiles and laydown areas on camera
  • Volumes measured on the map
A demolition stockpile, a loader and roll-off bins on a construction site, seen from above.

Volumes

Stockpile and earthwork volumes

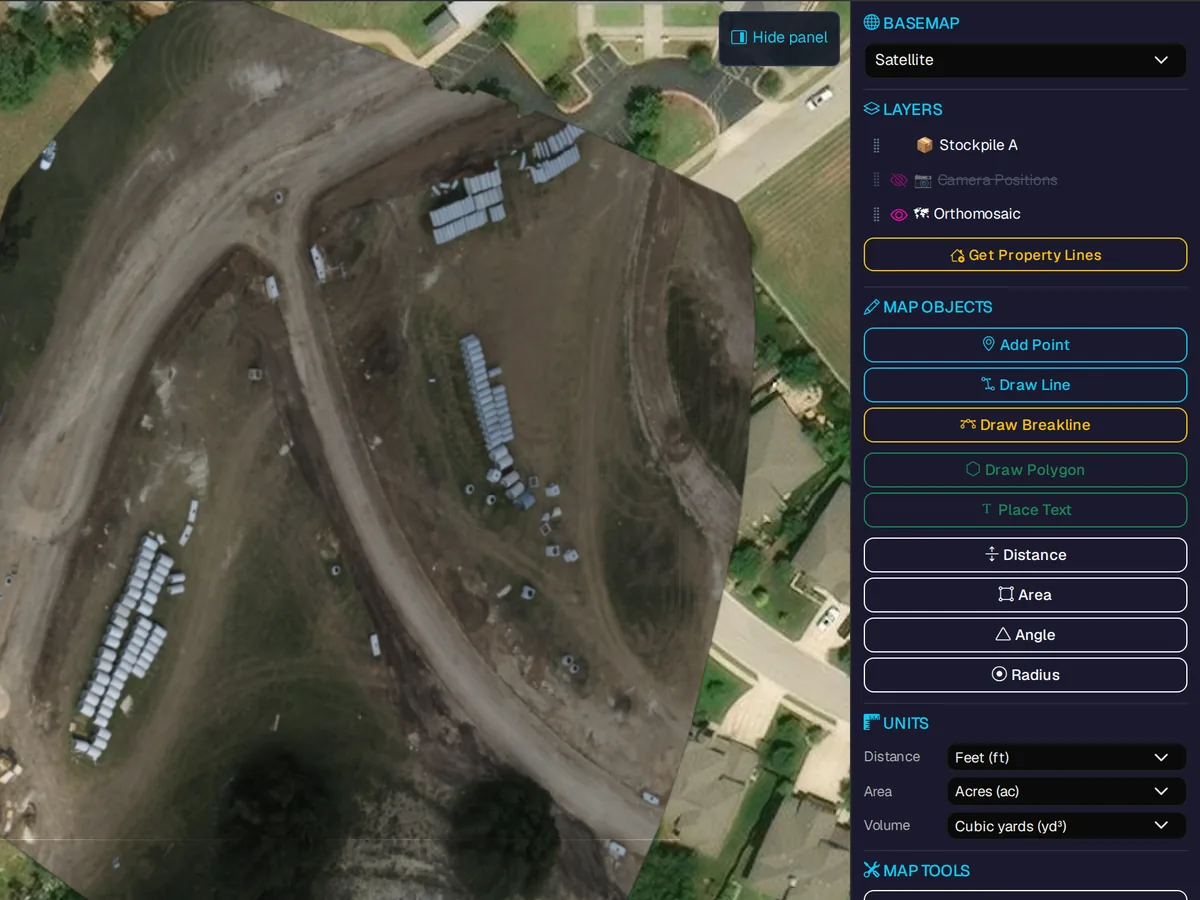
Draw a polygon in the survey viewer and read the volume measurement for the project, alongside distance and area tools.

  • Polygon measurement
  • Cut / fill / net readout
Orthomosaic of an earthworks site with stockpile layers, map objects and distance, area and volume tools.

Stakeholder portal

Owners and architects see the same view

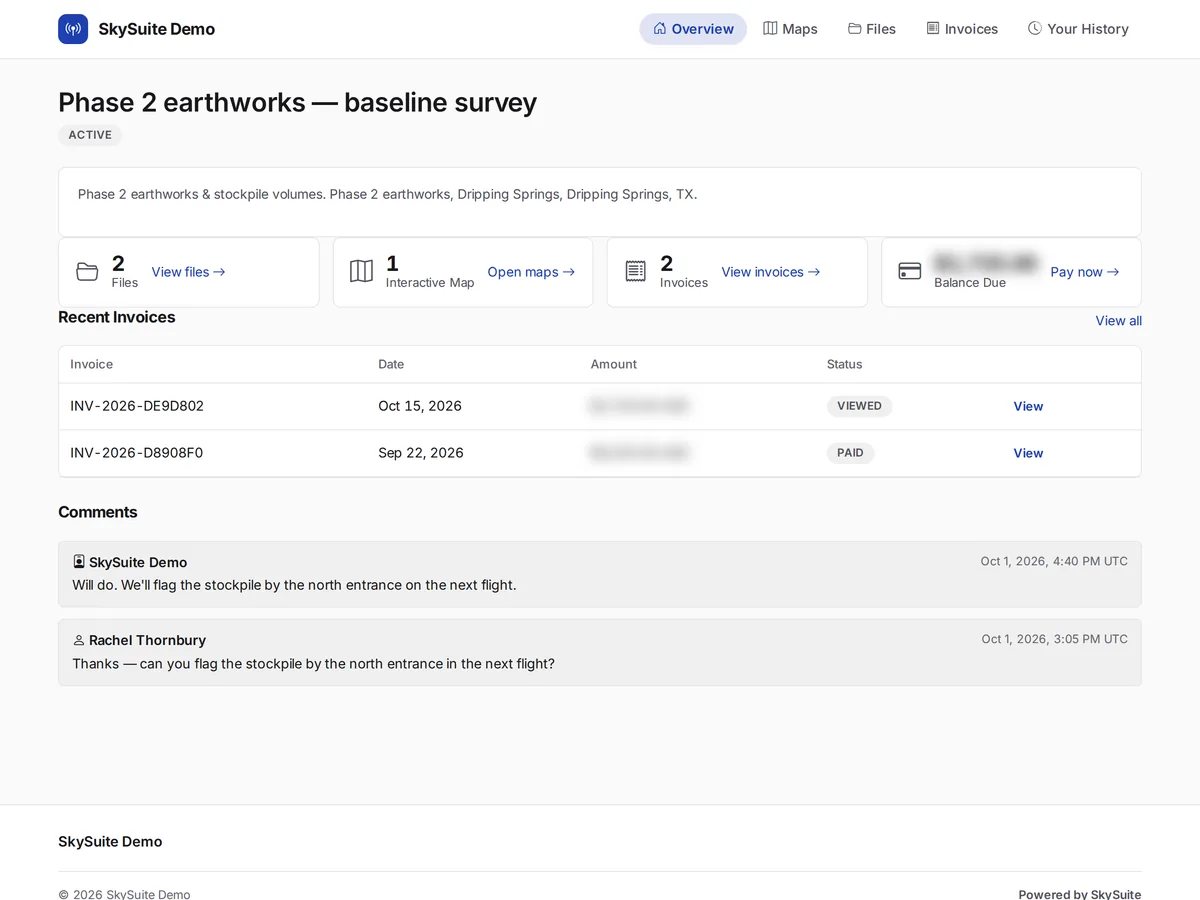
Share the map and files through one portal link, so owners, architects and project managers look at the same up-to-date site.

  • Portal branding on your plan
  • Granular permissions
  • Comments on the project
The client delivery portal: a baseline survey package with its files, interactive map and invoices, a teammate invite and project comments.

Document the site once, share with everyone.

Free never runs out. No card required. Try Pro free for 14 days, or 30 days with a card. Map your next site visit today, or book a demo and we'll walk through a progress map with you.

Comparing plans? See plans & pricing.